Now and Then: How Australian Life Has Changed in a Generation
Can you guess which Australians paid less than $75 per week in rent? Hint: it might have been you

In 2016, the demographer Bernard Salt caused a rather embarrassing national stir. In an article, Salt suggested (in jest, he later claimed) that young Australians might be able to buy a property if only they would stop drinking overpriced coffee from “hipster” cafes, and paying an exorbitant $22 a pop for smashed avocado with crumbled feta on five-grain toast. “I can afford to eat this for lunch because I am middle-aged and have raised my family,” Salt wrote in what was to become an infamous article in The Australian. “But how can young people afford to eat like this? Shouldn’t they be economising by eating at home? How often are they eating out? Twenty-two dollars several times a week could go towards a deposit on a house.”
In a study of 47 countries with advanced and emerging economies, a 2017 paper from the Bank for International Settlements reported that Australian house prices have surged by a whopping 300-400 per cent since the early 1960s. Compared to other advanced economies, we clocked the third highest rise in annual property prices in countries with an advanced economy, and registered the world’s longest upswing.
All in the Family: 4 Tips for a Thriving Multi-Generational Home
All in the Family: 4 Tips for a Thriving Multi-Generational Home
Many of us might politely agree to disagree about the virtues or otherwise of eating smashed avocado at hipster cafes. But, putting differences aside, it’s tough to argue that times have not changed. To get a better understanding of what’s different – and what’s the same – Houzz took a trip down memory lane and compared the 1986 Australian census with the most recent 2016 instalment, to find out how we’re living, one generation on.
Median family incomes over time
In 1986, a total of 15,602,156 people sat down to complete the Australian census on the allotted night. Australia’s population had already reached 16 million and of the dutiful bunch who took part in the census, together they registered a median annual family income of $24,500.
Fast forward to 2016. Of the 23,401,892 people who completed the country’s first and notoriously troublesome online census, the median weekly family income was $1,734, which translates to $90,168 per annum.
Tip: Keep in mind that the compositions of households vary significantly, from single households to families and groups, all of which register different incomes.
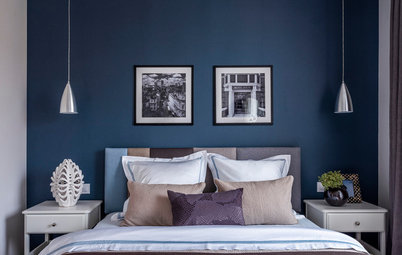
Mortgage and rent repayments
Back in the good old days of ’86, most households paid less than $400 per month in mortgage repayments. During this time, renters could also expect to pay under $75 per week. Back to the future and median rent in 2016 climbed to a hefty $335 per week, according to the latest census results. Our median monthly mortgage repayments also set Aussies back to the tune of $1,755.
Tip: Remember that median and mean statistics account for a wide range of figures – both significantly higher and lower.
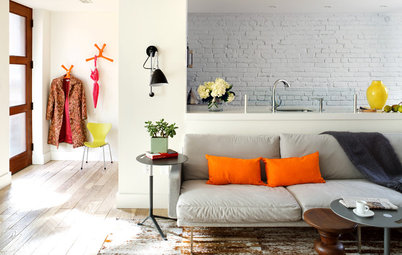
Owners, borrowers and renters
In 1986, a lucky 36 per cent of Aussies owned their home, while 37 per cent were in the process of paying it off, and just 24 per cent rented. Compare this to the 2016 census and we get a curiously different picture. Of the respondents, 31 per cent owned their home outright, 34.5 per cent had a mortgage, and 30.9 per cent rented – a significant leap.
In 1986, a lucky 36 per cent of Aussies owned their home, while 37 per cent were in the process of paying it off, and just 24 per cent rented. Compare this to the 2016 census and we get a curiously different picture. Of the respondents, 31 per cent owned their home outright, 34.5 per cent had a mortgage, and 30.9 per cent rented – a significant leap.
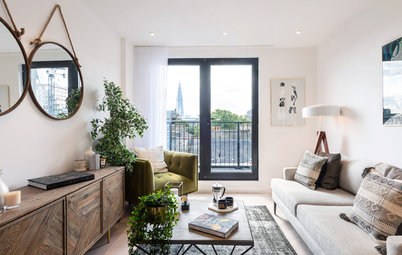
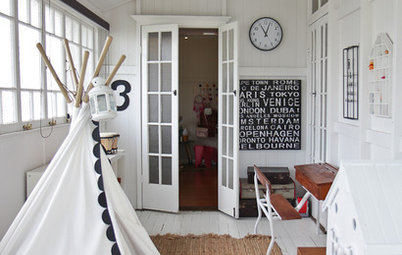
The rise of apartment living
Here’s where things get interesting. One generation ago, 81 per cent of people surveyed lived in freestanding or semi-detached homes, while most of the remainder occupied medium-density housing such as terraces or units in apartment buildings of three storeys or less.
These days, 72.9 per cent of Aussies reported living in a freestanding house, 13.1 per cent in an apartment, and 12.7 occupied a townhouse, terrace or semi-detached. More Australians are now living in apartments than ever before. In 2016, 38 per cent of all occupied apartment blocks were four or more storeys – a far cry from the ’80s developments of three levels or less.
Glance quickly at the ever-changing and developing skylines of most Australian cities and you’ll see this trend playing out. It’s a tangible reminder of the increasing prevalence of apartment living, and the growing size of many residential developments.
Empty Nester’s Guide to Downsizing to an Apartment
Empty Nester’s Guide to Downsizing to an Apartment
Location and age of today’s apartment dwellers
In 2016, 47 per cent of all Aussie apartments were located in New South Wales, followed by 23 per cent in Victoria and 17 per cent in Queensland. And as you’d expect, most of these apartments were in capital cities.
If you were between 25 and 34 years old in 2016, you were officially the largest group of Australian apartment dwellers. In total, 29 per cent of all apartment residents fell into this age category, followed by 11 per cent of children aged up to 14 years old. This reflects the growing number of Australian families who are currently raising children in apartments.
Household cars
A generation ago, 44 per cent of households owned two or more vehicles and 43 per cent owned one. These days, it’s a little different. Of 2016 households, 36.2 per cent have two vehicles registered to their address, 34.8 per cent have one and 18.1 per cent lay claim to three or more vehicles.
A generation ago, 44 per cent of households owned two or more vehicles and 43 per cent owned one. These days, it’s a little different. Of 2016 households, 36.2 per cent have two vehicles registered to their address, 34.8 per cent have one and 18.1 per cent lay claim to three or more vehicles.
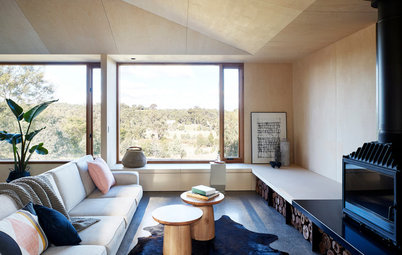
Size matters
Two years before the 1986 census, in different research the Australian Bureau of Statistics recorded the average floor area of all newly built Australian houses as 162.4 square metres. In 2013 this figure had risen to 241.1 square metres. In comparison, the average floor space of other new residential dwellings such as apartments increased from 99.2 square metres to 133.9 square metres over the same time period.
Tell us
What changes in living situations have you noticed over time? We’d love to hear your memories and experiences in the Comments. And if you found this interesting, be sure to like or save this story and join the conversation.
More
Read more lifestyle stories on Houzz


If you had listened to the ‘hipsters’ who put down their forks and paused between mouthfuls of deconstructed brunch, you would have heard their collective cries of protest pointing out that Australia’s housing prices have jumped 70 per cent in five years, while wages have grown just 13 per cent. This is the real reason they were sitting at a cafe enjoying oddly artistic food, they argue, instead of standing at an auction, placing the winning bid – brunch they could afford, property they could not.